Enterprise Insights delivers a unified, enterprise-grade reporting and analytics capability within isofy that empowers operators of flexible workspaces to understand, optimize, and communicate how their space is being used. This feature supports data-driven decision-making across space utilization, network performance, member engagement, and site health - ultimately improving operational efficiency.
- Visualize utilization by time, user, and network
- Measure detailed bandwidth and application usage
- Track check-ins, repeat guests, and inactive users
- Translate network activity into operational signals network activity into operational signals
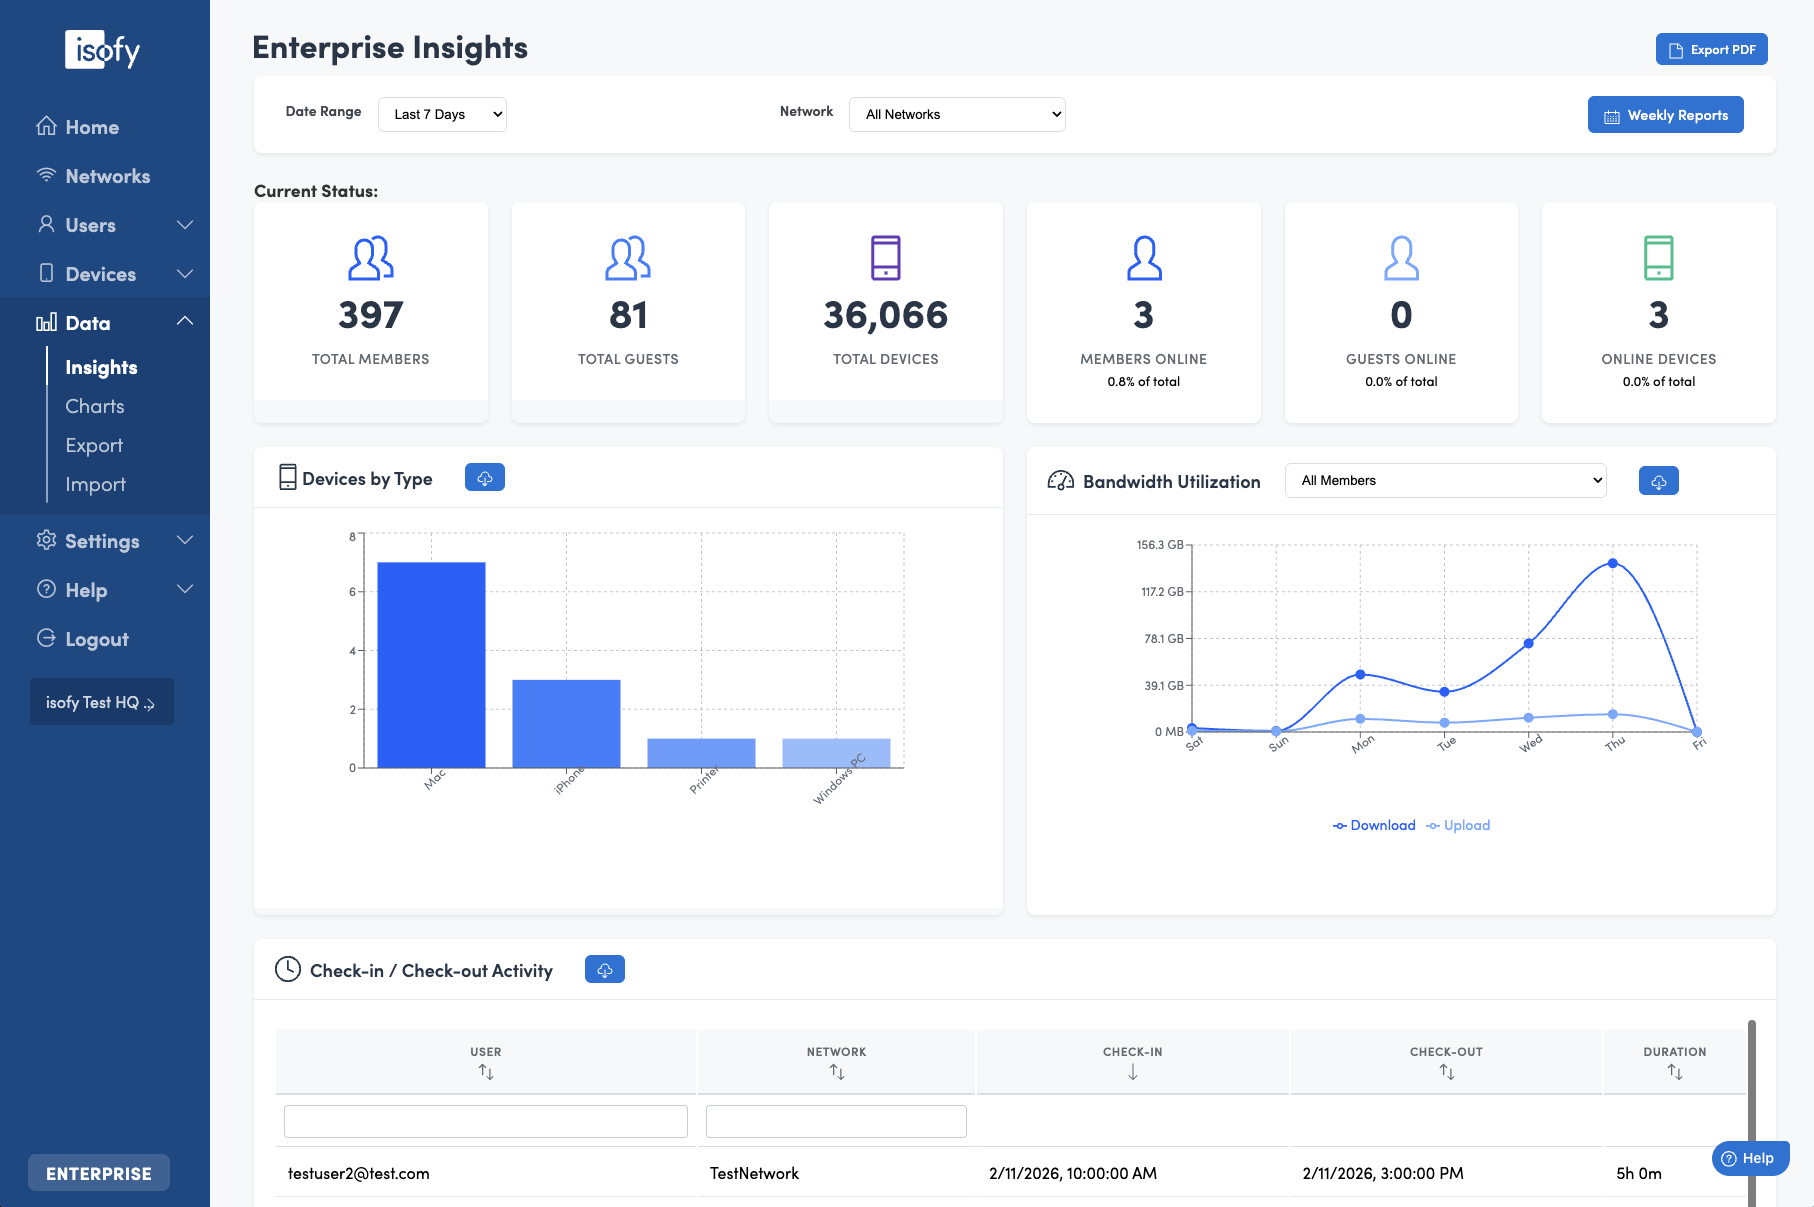
Table of Contents
- Availability
- Top Heading Bar
- Current Status
- Devices by Type
- Bandwidth Utilization
- Check-in Check-out Activity
- Users Not Seen Recently
- Total Network Utilization Heat Map
- Repeat Guests
- Heavy User Leaderboard
- Application Insights
- Roaming Members
- Chart Data Download
Availability
Enterprise Insights is available to clients on the isofy ENTERPRISE tier. It is accessible on the blue left navigation menu as Data -> Insights.
Top Heading Bar
From the top heading you can perform several actions:
- Export and download the current view as a PDF
- Subscribe to receive a weekly Insights report delivered to your email every Monday
- Select the date range for the Insights data
- View all data or limit the data to a specific Network
Current Status
The tiles across the Current Status section will give you counts for:
- Total Members
- Total Guests
- Total Devices
- Members currently online
- Guests currently online
- Devices currently online
Note: the selected Date Range does not affect these counts as these are overall totals for your site.
Note: when selecting a specific Network, the Guest tiles are no longer relevant and they are hidden.
Devices by Type
This shows a breakdown of the types of devices that are active on your network.
Bandwidth Utilization
The data volume downloaded and uploaded on your network. This can be shown for all members for you may select a specific member.
Check-in Check-out Activity
Historical data that shows when users first and last appeared on your network by day.
- Check-out time for a day is not real time for the current day, and it is not calculated until a few minutes after midnight the next day.
- Users may still appear as checked-in over longer periods if they leave a deice behind such as a laptop or mobile phone and that device maintains an open connection to the network.
Users Not Seen Recently
Members of your space that have not been present in some time.
Total Network Utilization Heat Map
For the given time period shows the most active hours and days during the week.
Repeat Guests
Guests that have visited your space more than once.
Heavy User Leaderboard
The users that have downloaded/uploaded the most data during the selected period.
Application Insights
If your firewall supports it, the best effort determination of the types of applications being used on your network and how much data is utilized.
Roaming Members
If you have the Roaming feature enabled for your organization, a list of Members present/visiting at your location that are from a different home location.
Chart Data Download
For every chart, you may click the download icon in the chart title to export a csv - comma delimited data file for that chart. 
Was this article helpful?
That’s Great!
Thank you for your feedback
Sorry! We couldn't be helpful
Thank you for your feedback
Feedback sent
We appreciate your effort and will try to fix the article